Table of Contents
In the fast-paced world of technology, incidents are inevitable. When they strike, every second counts. Traditional incident response can be a manual, time-consuming process, often leading to delays and increased stress for on-call teams.
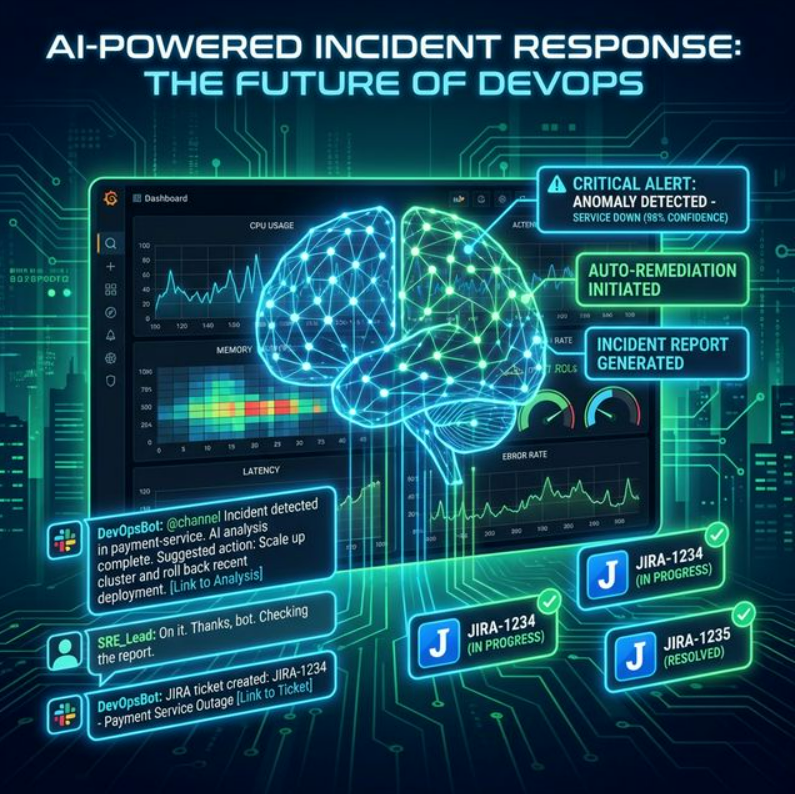
This blog post will guide you through building an AI-powered incident response pipeline that integrates Prometheus for alerting, a Large Language Model (LLM) for summarizing logs, Slack for communication, and an automated system for ticket creation. By the end, you'll have a robust, intelligent system that significantly reduces Mean Time To Resolution (MTTR).
The Architecture
Let's break down each component in detail.
1. Prometheus & Alertmanager: The Foundation of Monitoring
Prometheus is an open-source monitoring system with a powerful data model and query language (PromQL). Alertmanager handles alerts sent by Prometheus, deduplicating, grouping, and routing them to the correct receiver.
Prometheus Alert Rule
groups:
  - name: example-alerts
    rules:
      - alert: HighErrorRate
        expr: |
          sum(rate(http_requests_total{status_code=~"5xx"}[5m])) by (job)
          / sum(rate(http_requests_total[5m])) by (job) > 0.05
        for: 5m
        labels:
          severity: critical
        annotations:
          summary: "High error rate on {{ $labels.job }}"
          description: "HTTP error rate exceeded 5% for 5+ minutes."
Alertmanager Configuration
route:
  receiver: 'incident-orchestrator'
  group_by: ['alertname', 'job']
  group_wait: 30s
  group_interval: 5m
  repeat_interval: 1h

receivers:
  - name: 'incident-orchestrator'
    webhook_configs:
      - url: 'http://<your-orchestrator-url>/webhook'
        send_resolved: true
2. The Incident Orchestrator
This is the brain of our operation. It receives alerts from Alertmanager, fetches relevant logs, calls the LLM, posts to Slack, and creates tickets — all automatically.
Flask Orchestrator (Python)
from flask import Flask, request, jsonify
import requests, os, json

app = Flask(__name__)

SLACK_WEBHOOK_URL  = os.getenv("SLACK_WEBHOOK_URL")
JIRA_API_URL       = os.getenv("JIRA_API_URL")
JIRA_USERNAME      = os.getenv("JIRA_USERNAME")
JIRA_API_TOKEN     = os.getenv("JIRA_API_TOKEN")
LLM_API_ENDPOINT   = os.getenv("LLM_API_ENDPOINT")
LOG_FETCH_ENDPOINT = os.getenv("LOG_FETCH_ENDPOINT")

@app.route('/webhook', methods=['POST'])
def handle_alert():
    alert_data = request.get_json()
    for alert in alert_data.get('alerts', []):
        if alert['status'] == 'firing':
            alert_name  = alert['labels'].get('alertname', 'Unknown')
            job         = alert['labels'].get('job', 'Unknown')
            severity    = alert['labels'].get('severity', 'info')
            summary     = alert['annotations'].get('summary', '')
            description = alert['annotations'].get('description', '')

            logs        = fetch_logs(job, alert['startsAt'])
            log_summary = summarize_logs_with_llm(logs, description)

            send_slack_message({
                "text": (f"🚨 *INCIDENT: {alert_name}*\n"
                         f"Severity: `{severity}` | Job: `{job}`\n"
                         f"Summary: {summary}\n\n"
                         f"🤖 *LLM Summary:* {log_summary}")
            })
            create_jira_ticket(alert_name, description, log_summary, severity)

    return jsonify({"status": "success"}), 200

# --- Helper functions defined below ---def fetch_logs(job_name, start_time):
try:
r = requests.get(LOG_FETCH_ENDPOINT,
params={'job': job_name, 'start': start_time},
timeout=10)
r.raise_for_status()
return r.text
except requests.exceptions.RequestException as e:
return f"Failed to fetch logs: {e}"
def summarize_logs_with_llm(logs, description):
prompt = (f"Incident: '{description}'\n\nLogs:\n{logs}\n\n"
f"Summarize the key issues and root causes concisely.")
try:
r = requests.post(LLM_API_ENDPOINT, json={'prompt': prompt}, timeout=30)
r.raise_for_status()
return r.json().get('summary', 'No summary from LLM.')
except requests.exceptions.RequestException as e:
return f"LLM error: {e}"
def send_slack_message(message):
requests.post(SLACK_WEBHOOK_URL, json=message,
headers={'Content-Type': 'application/json'})
def create_jira_ticket(alert_name, description, log_summary, severity):
payload = {
"fields": {
"project": {"key": "OPS"},
"summary": f"[INCIDENT] {alert_name}",
"description": f"{description}\n\nLLM Summary: {log_summary}",
"issuetype": {"name": "Bug"},
"priority": {"name": "High" if severity == "critical" else "Medium"}
}
}
r = requests.post(JIRA_API_URL,
headers={"Content-Type": "application/json"},
auth=(JIRA_USERNAME, JIRA_API_TOKEN),
json=payload)
r.raise_for_status()
print(f"Jira ticket: {r.json()['key']}")
if __name__ == '__main__':
app.run(debug=True, host='0.0.0.0', port=5000)3. LLM Log Summarizer
Instead of sifting through thousands of log lines, an LLM extracts critical information, identifies patterns, and suggests potential root causes in seconds.
OpenAI Integration
import openai, os

openai.api_key = os.getenv("OPENAI_API_KEY")

def summarize_logs_with_llm(logs, description):
    messages = [
        {
            "role": "system",
            "content": ("You are an expert SRE assistant. Analyze incident logs "
                        "and provide a concise summary of the problem and root causes.")
        },
        {
            "role": "user",
            "content": (f"Alert: '{description}'\n\nLogs:\n{logs}\n\n"
                        "Summarize the incident and suggest possible causes.")
        }
    ]
    try:
        resp = openai.ChatCompletion.create(
            model="gpt-4",
            messages=messages,
            temperature=0.7,
            max_tokens=500
        )
        return resp.choices[0].message['content'].strip()
    except Exception as e:
        return f"LLM error: {e}"
4. Slack Integration
Slack serves as the central communication hub. The orchestrator posts detailed alerts, LLM summaries, and ticket links into a designated #incidents channel instantly.
SLACK_WEBHOOK_URL environment variable.Sample Slack Notification Format
🚨 INCIDENT ALERT: HighErrorRate 🚨
Severity: `critical`
Job: `api-server`
Summary: High error rate detected on api-server
Description: HTTP error rate exceeded 5% for 5+ minutes.

🤖 LLM Log Summary:
The logs show a spike in 503 errors starting at 14:32 UTC,
correlating with a database connection timeout. Root cause
likely: max connection pool reached due to traffic surge.

🔗 View in Prometheus  |  🎫 Jira: OPS-1234
5. Auto-Ticket Creation (Jira)
Automating Jira ticket creation ensures every incident is tracked, assigned, and can be reviewed post-mortem — with rich AI-generated context baked right in.
JIRA_API_TOKEN. Use AWS Secrets
Manager, HashiCorp Vault, or Kubernetes Secrets.Deployment Considerations
Serverless
Deploy the orchestrator as AWS Lambda or Google Cloud Function for zero-ops scaling.
Containerized
Run on Kubernetes with Docker for more control over resources and networking.
Log Aggregation
Centralize logs with Loki, ELK, Splunk, or Datadog for efficient querying.
Secrets Management
Use AWS Secrets Manager or Vault. Never hardcode sensitive credentials.
Benefits of an AI-Powered Pipeline
- Faster MTTR: Automated log summarization and instant notifications cut resolution time significantly.
- Less Cognitive Load: On-call engineers get pre-digested information, not raw log dumps.
- Consistent Process: Standardized alert handling ensures every incident is treated equally.
- Richer Post-Mortems: Auto-linked tickets and summaries provide full context for root cause analysis.
Future Enhancements
- Automated Remediation: The LLM suggests and triggers runbooks for known incident types.
- Incident Correlation: Cluster multiple related alerts into one parent incident.
- Knowledge Base Integration: Query internal wikis to surface relevant runbooks automatically.
- Predictive Alerting: Use time-series anomaly detection to fire alerts before the problem is user-visible.
Conclusion
Building an AI-powered incident response pipeline is a significant step toward a more resilient operational environment. By combining Prometheus for monitoring, LLMs for intelligent analysis, and integrations with Slack and Jira, you empower your teams to respond with unprecedented speed and clarity.
The result: happier engineers and more stable systems.